Interview Prep & Analytics
Keep every interview round in one timeline, and let your own data tell you how the search is going. Both screens are 0-token: plain code over your local database.
Interview Prep
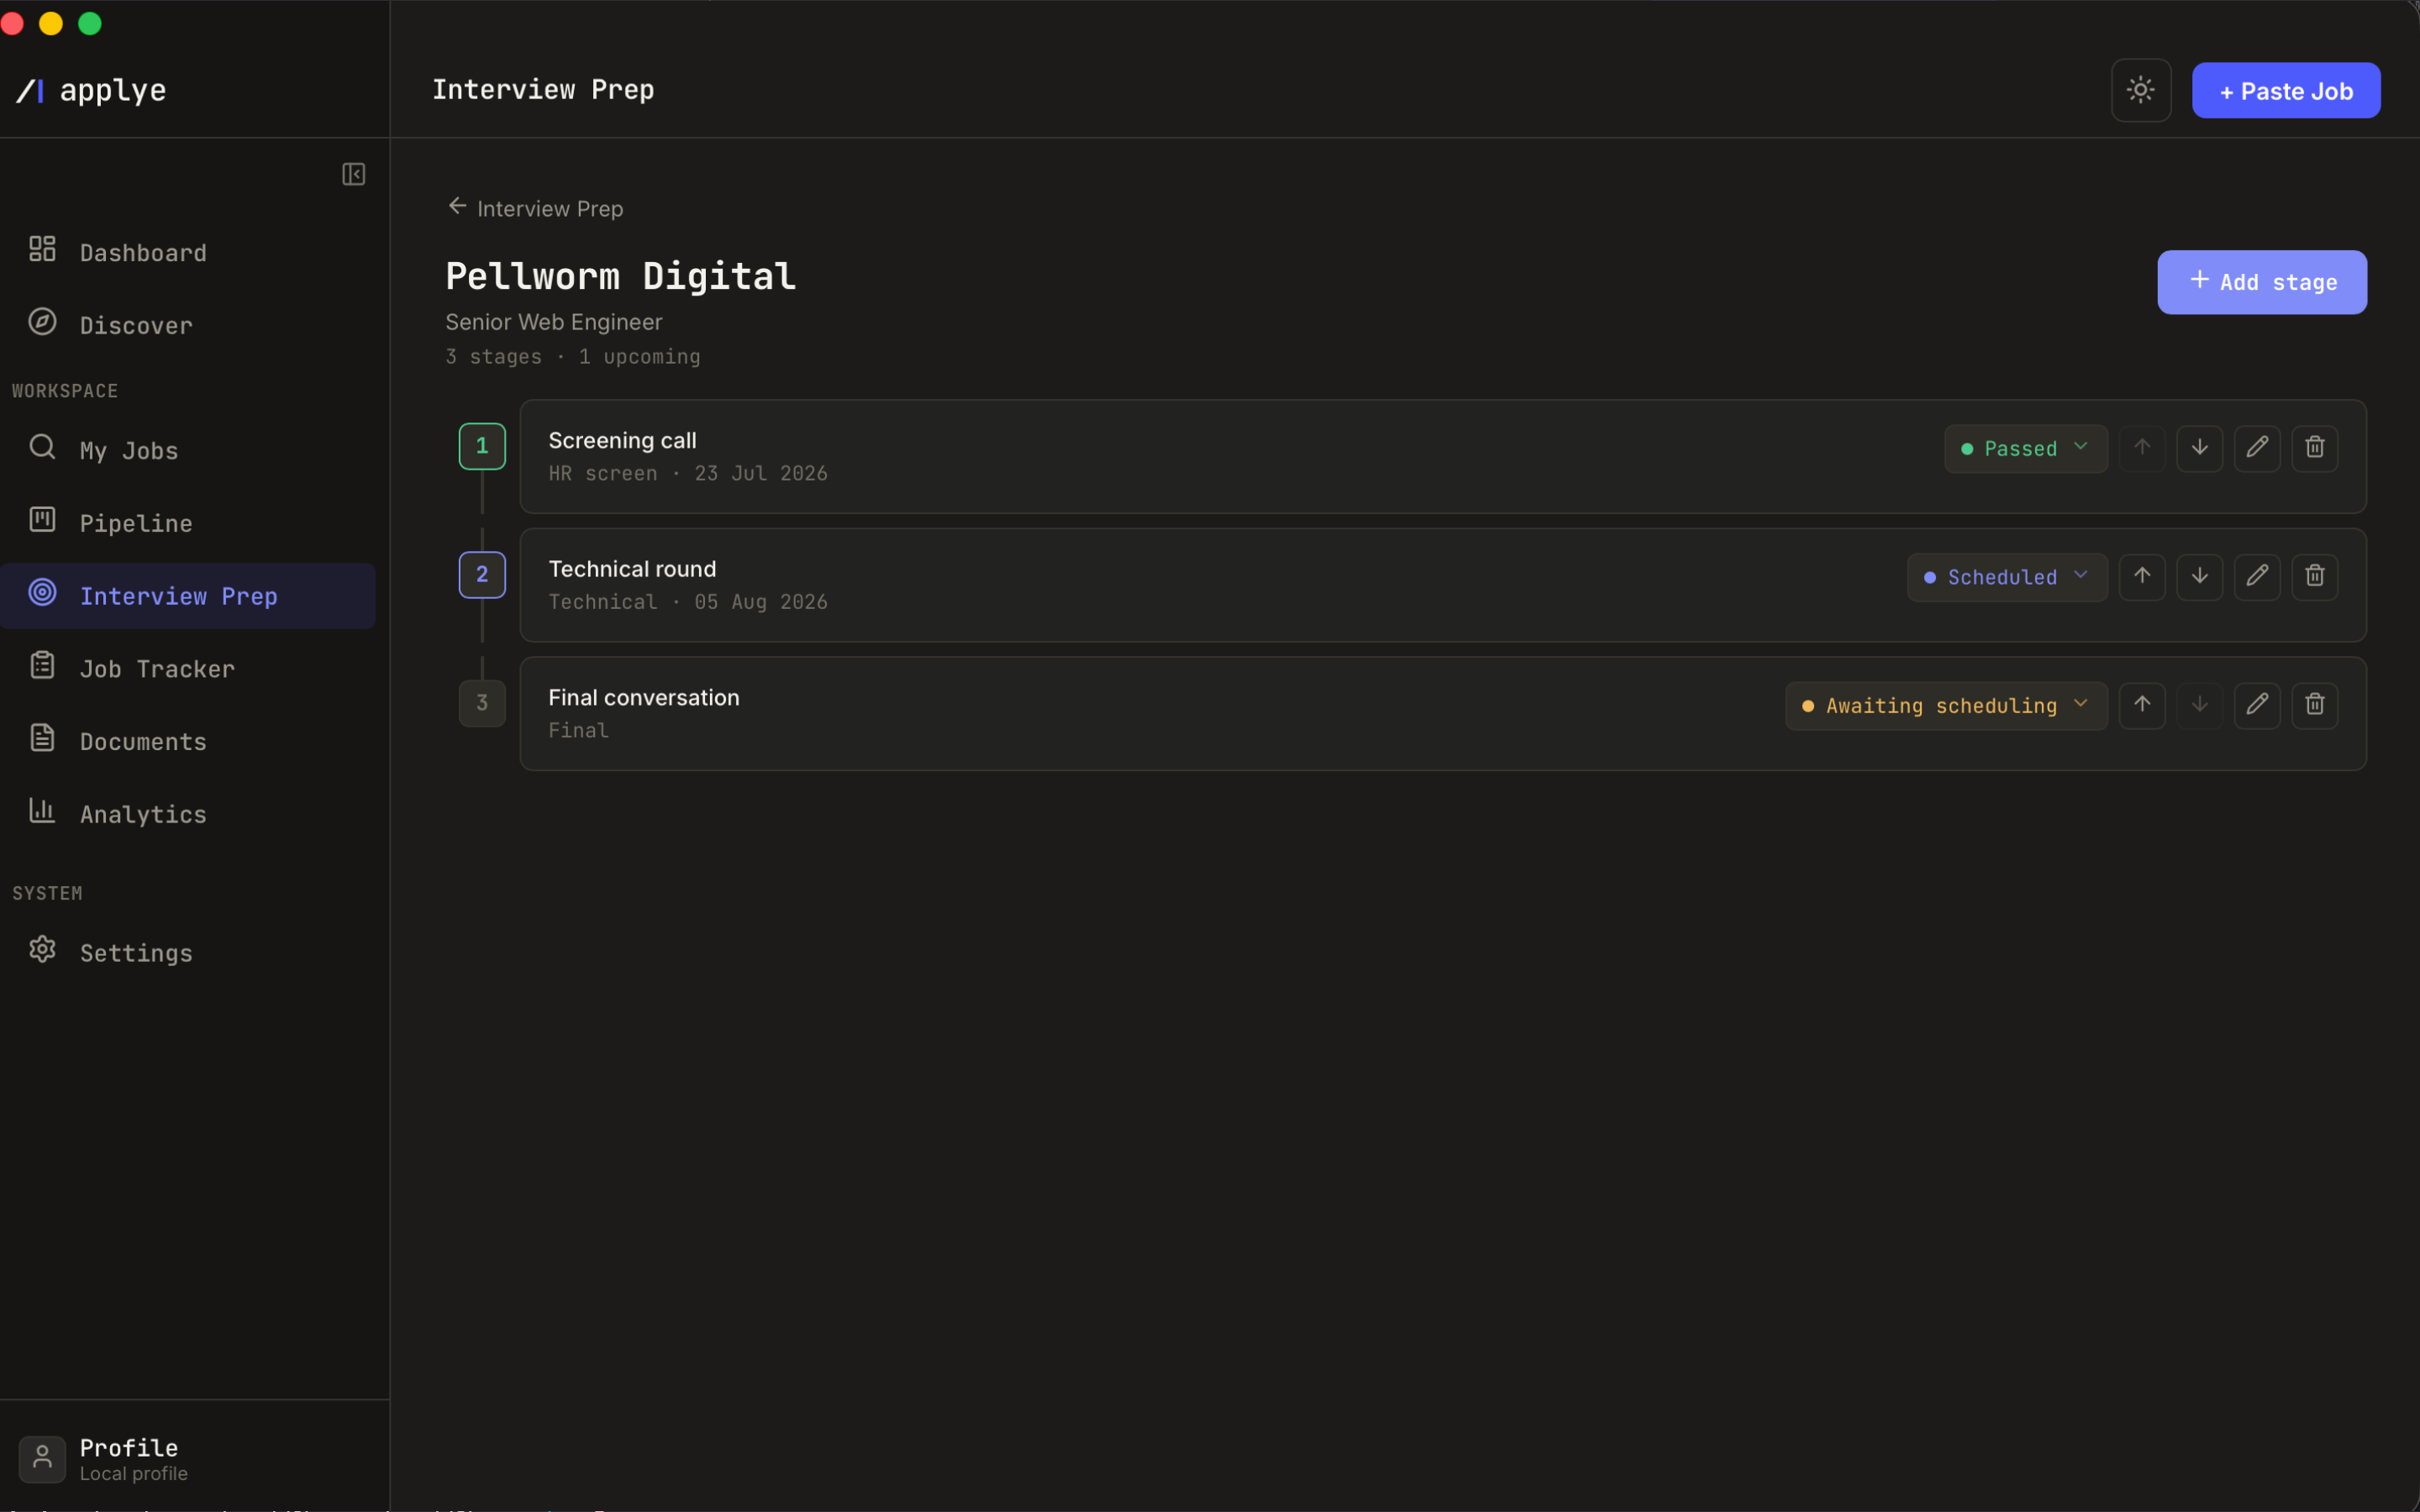
- The list shows every application you are interviewing for, with the next date on top.
- Open one for the stage timeline: each round is a card with its type, date, interviewer, notes, and a colour-coded status you change in place.
- Add or edit stages in a small modal; reorder them; remove an application from prep without touching the job itself.
Analytics
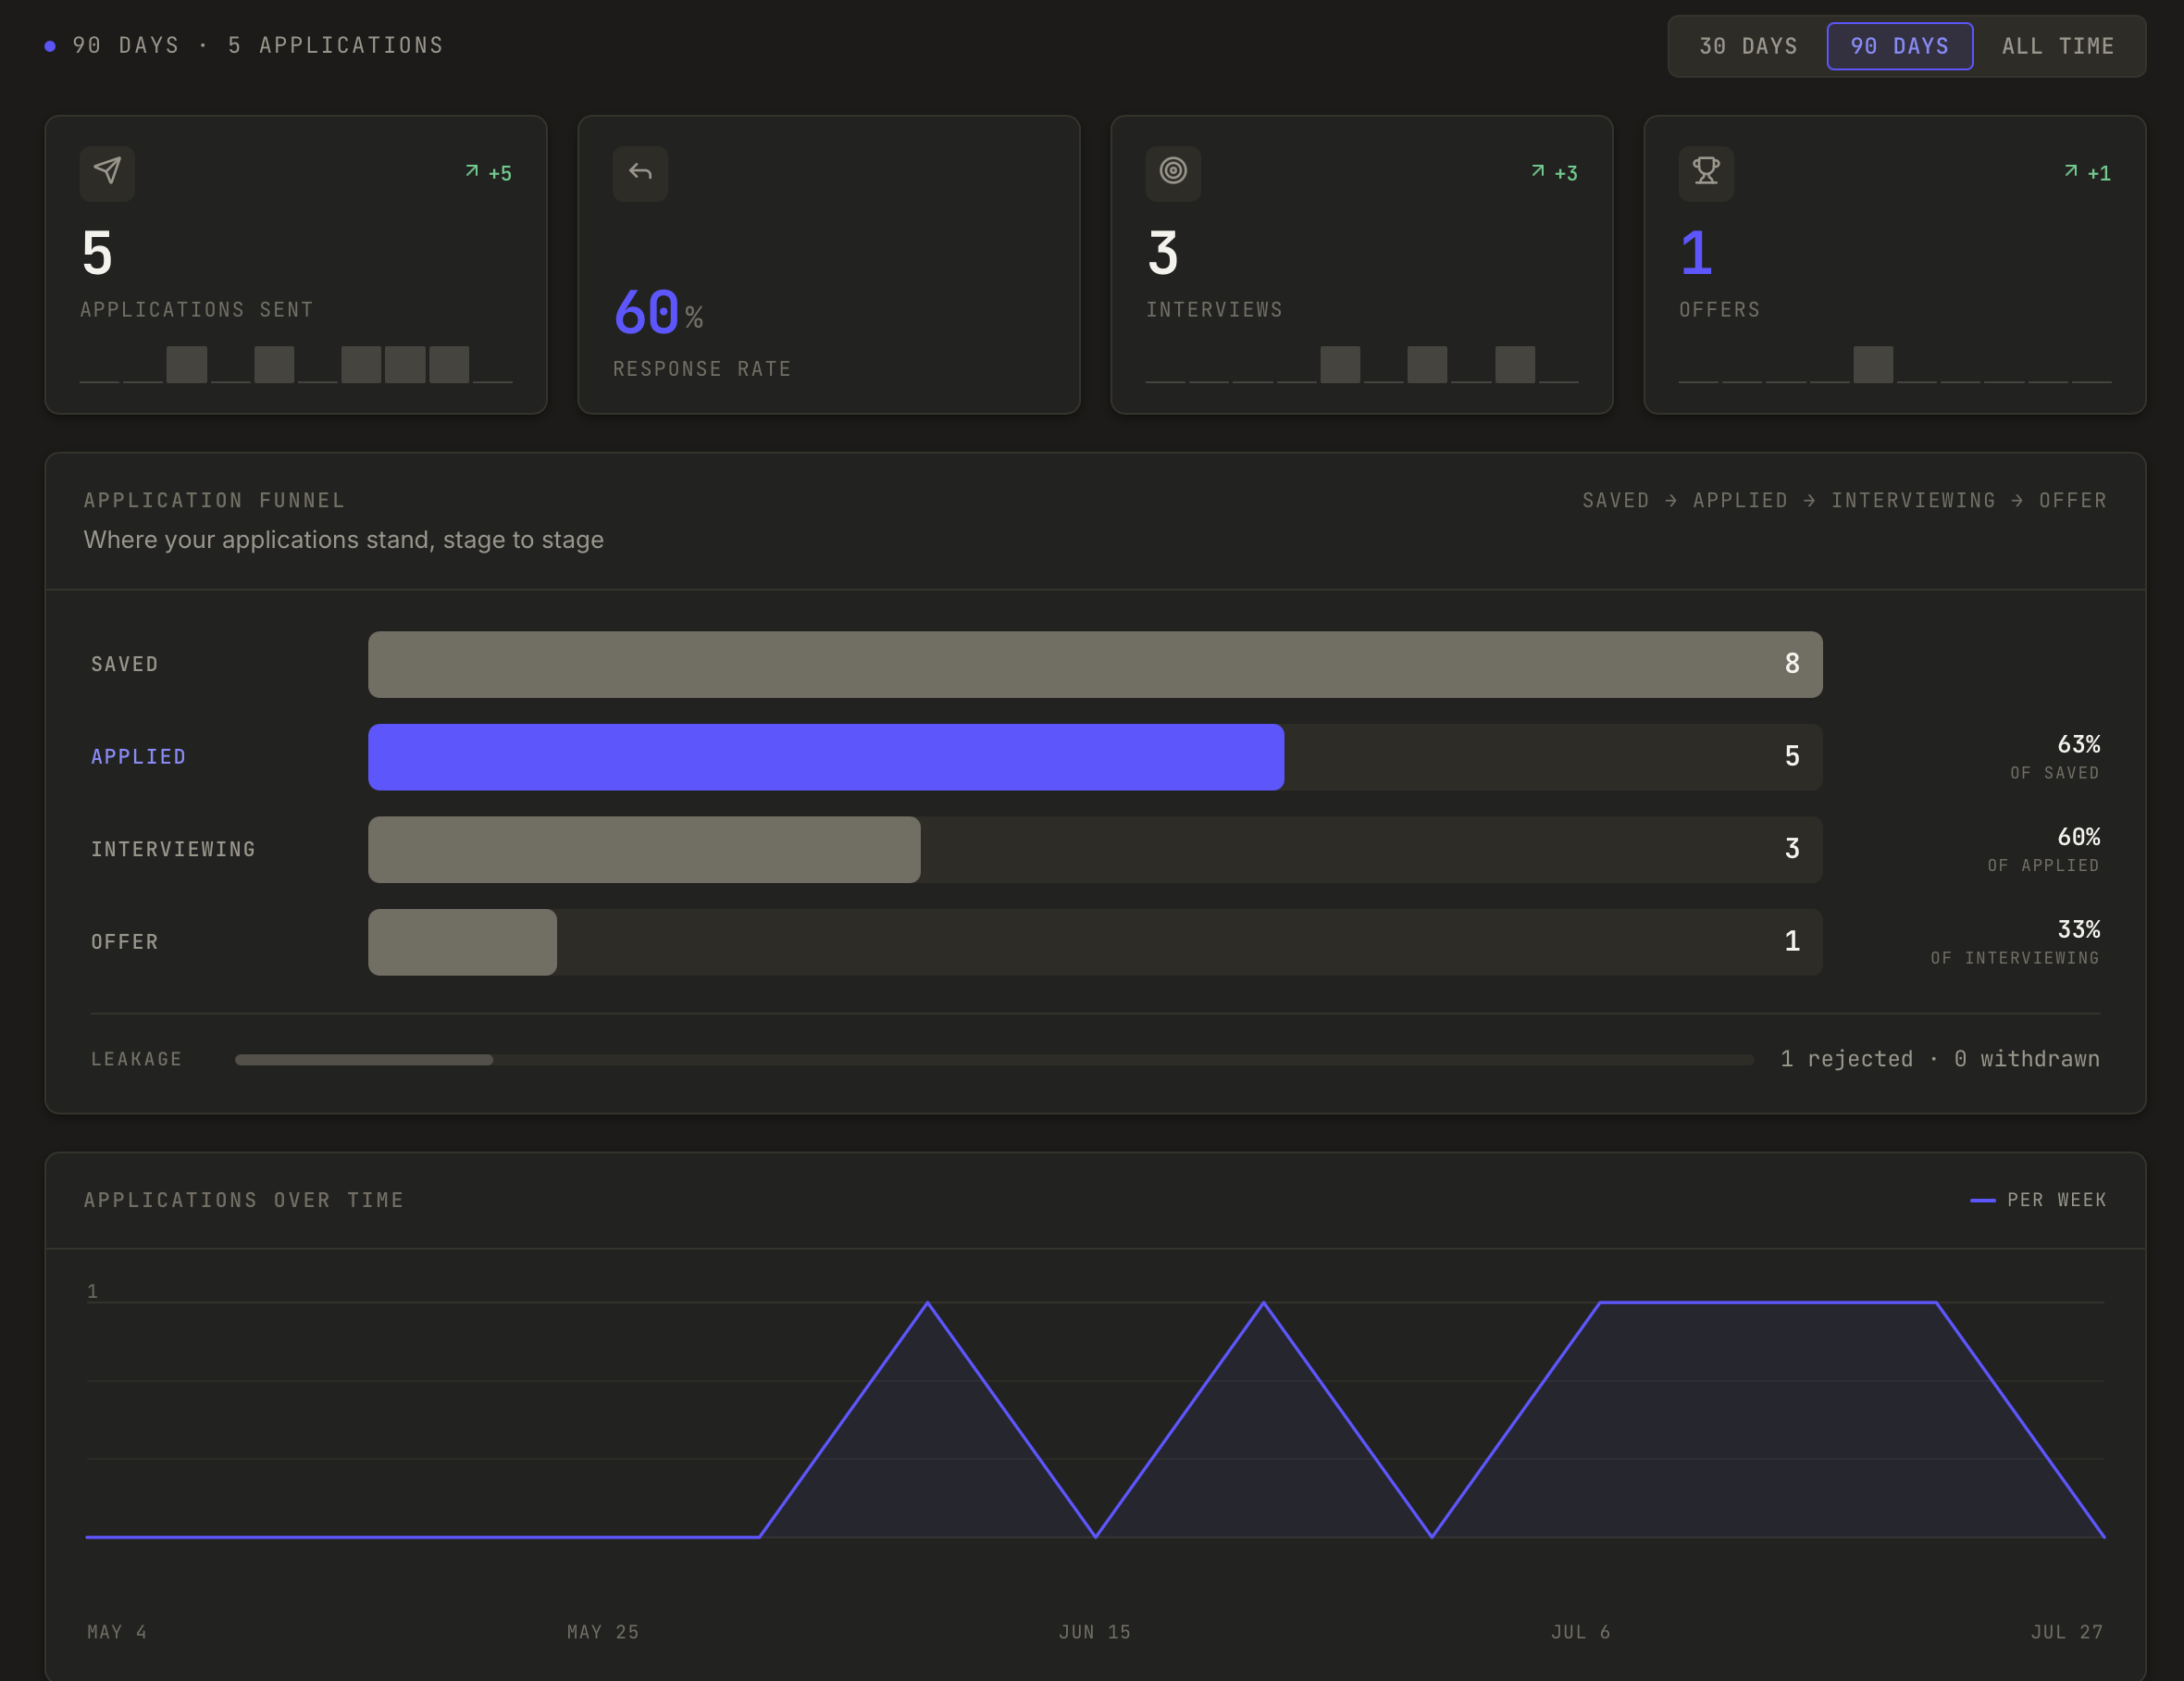
Pick a period (30 days / 90 days / all time) and read:
- Four counters - applications, response rate, interviews, offers, each with a trend vs the previous period.
- The funnel - saved to applied to interviewing to offer, with conversion at each step and rejections tracked as leakage.
- Applications over time - your volume, with follow-up activity overlaid.
- Match-score distribution and score vs outcome - are you applying to well-matched roles, and do higher-fit ones actually get further?
- Time to response, pipeline aging (stalled past 14 days gets flagged), and where you are applying.
With few applications it shows honest raw counts instead of misleading percentages; no external benchmarks, ever.